Grafana, InfluxDB, and collectd for systems monitoring and dashboarding
I’ve seen some pretty interesting Grafana graphs floating around the interwebs recently and finally made some time to investigate all the hype. I found a great blog post on how this technology is laid out; that blog post should be all you need to get started. I started by creating a new VM to host both my InfluxDB database, and the Grafana dashboarding service. Then I installed and enabled collectd on all the systems I wanted to collect data on. I enabled some of the basic plugins like smartd, libvirt, etc. and was up and collecting data quite easily. Collectd does a great job of basic data collection services, most of the data you’d typically want is gathered without any extra configuration or fuss. The plugins available seem vast. InfluxDB on the other hand took me a little time to understand how a time series database is intended to work.
InfluxDB isn’t too far a stretch from basic SQL querying and data storage, but there are some small differences. Typically the two fields with data that you can perform functions on are the time field, and the value field of the data that you’re collecting. The rest of the entries are classified as “tags”, and function more as metadata than data itself. So for example, you can’t do a SUM() or DISTINCT() function on a tag, just the value field. But you can query using the tags like you would normally for filtering, grouping, or joining data. Additionally, what you’d normally call a table is now called a measurement. These changes are odd at first but as you start to understand the purpose, the data structure, and general intent of a time-series database they start to make good sense. (These changes are intended for query speed, and data storage surrounding time-series data.)
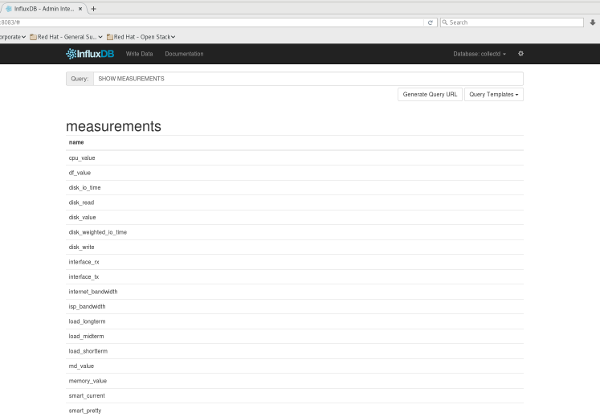
I created a collectd database in InfluxDB, and set the collectd daemons I setup to write their data here. After some data was collected and written, this is what my basic measurements (tables) structure had available for querying:
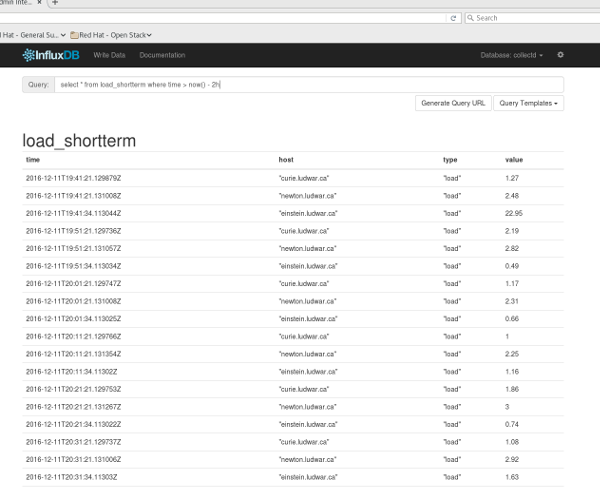
It was from here where I did a basic SQL query to see what kind of data was collected:
After opening up the Grafana interface, and creating a new dashboard, I found that Grafana has a place to directly insert these queries and will parse the data into the graphs I was used to seeing. My workflow then turned into refining SQL queries to grok the data I wanted, and then copy & pasting that query into Grafana for display. The first stats I went after were system load, free memory, and swap usage, as the systems I want monitored are all hypervisors. This is what I ended up with:
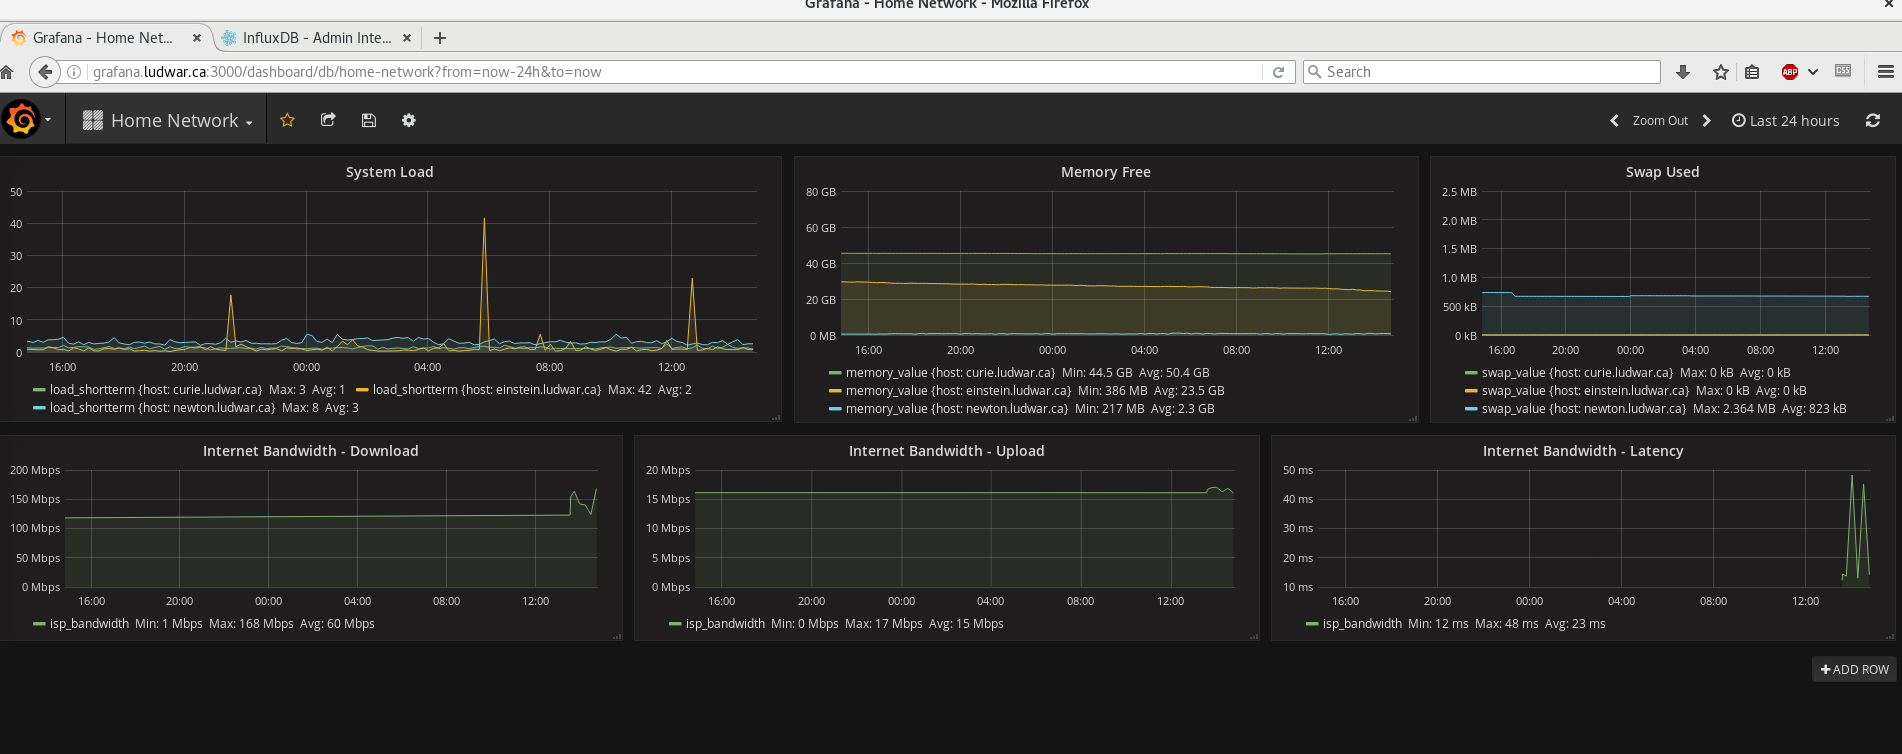
Very nice! The interface and graph creating is very intuitive, I won’t bother explaining it. But I will talk about the last three graphs, as I ended up parsing this data into InfluxDB manually myself. Grafana has a few pre-defined data sources that you can use, however they’re mostly other time-series databases or data aggregation frameworks. What happens if you’ve got other simpler metrics sources like scripts, or logs that you want made into pretty graphs? Keep reading, 🙂 .
I use speedtest-cli to do basic monitoring of my ISP internet connection. This is the command-line equivalent of using the speedtest.net browser speedtest. It makes some concessions in its accuracy/speed, however it’s still quite good at providing a basic up/down and latency test. Using this in conjunction with smokeping gives me a good health assessment of what my internet service provider is actually giving me. I’ve got several months of this speedtest data in logfiles that I want grokked into Grafana, but how do I do that considering Grafana’s data sources?
Well, after some investigating, I ended up writing a couple of python scripts that do manual inserts into the InfluxDB. This seemed to be the cleanest and easiest way forward of getting this data into a Grafana usable form. The two scripts are on my github if you’d like to use them. They are:
- speedtest-to-influxdb
- This script calls the speedtest-cli shell command, performs the test, captures the data, then inserts it into InfluxDB under a new measurement called isp_bandwidth. I’m then able to query as usual from InfluxDB.
- add_speed_data
- This script reads a logfile of previously captured speedtest-cli data, and inserts it into InfluxDB. On my github page you can find a formatted logfile for an example. If you’ve got similar data, it should be easy to use awk to format it to be used for this script.
During this process I noticed there had been a new speedtest utility released that does shortform results reporting. I switched to using this new form in the process, as this form also displays latency in addition to up/down bandwidth. So my previous log data won’t have the latency captured. Note, InfluxDB has good documentation on how to write data into it, should you need to. One should also note that the preferred data types to use in InfluxDB are either integer or float. It isn’t easy to convert already captured data into another data type, (I had originally and unknowningly imported all my log data in string format, which throws off the min/max/avg statistics among other things), so it’s important to do it correctly the first time around.
All in all, I’m pretty happy with the Grafana/InfluxDB/collectd experience. Once again, open source software is enabling users to have access to highly innovative and cost-effective solutions that drive value for their business.